Frequency Graph Display
(7-Band EQ Only)
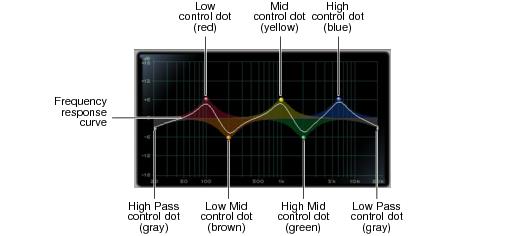
The Frequency Graph display in the 7-Band EQ shows a color-coded control dot that corresponds to the color of the Gain control for each band. The filter shape of each band is similarly color-coded. The white frequency response curve shows the contribution of each of the enabled filters to the overall EQ curve.
Frequency Graph display for the 7-Band EQ